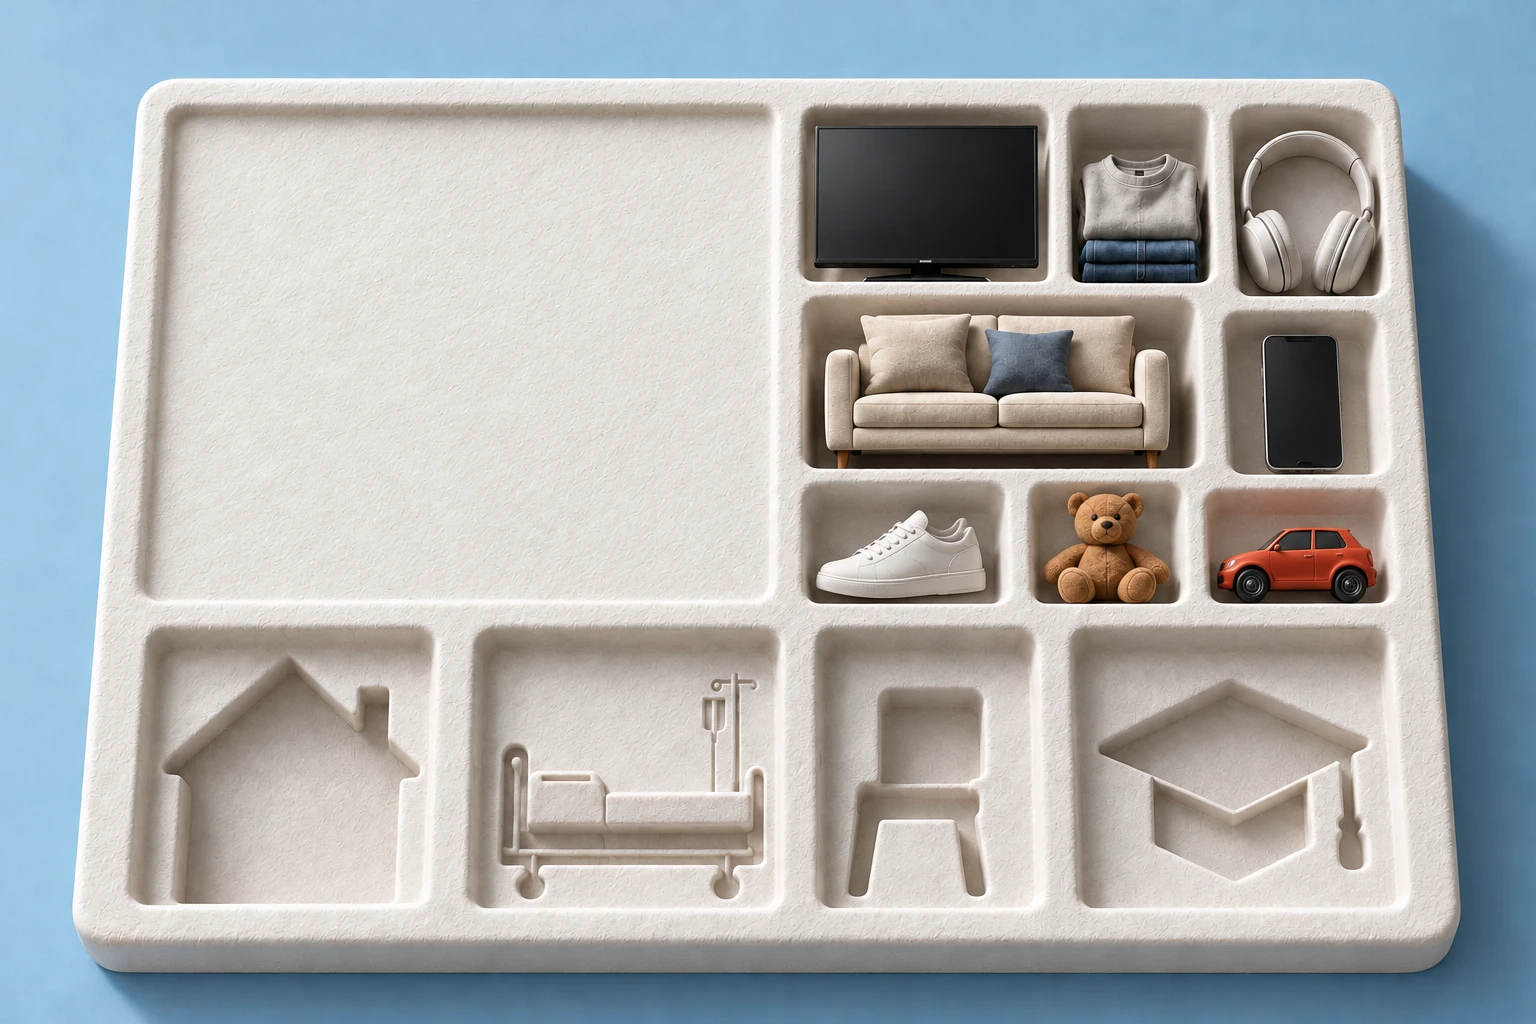
How We Made the Wrong Things Cheap
For twenty-five years, the price of a television fell while the price of a hospital stay, a year of college and a year of day care climbed, and the country’s mood followed its bills.


PROLOGUE · THE ARGUMENT
The $140,000 poverty line.
In November 2025, professional investor Michael Green posted an essay to his Substack built around a question he couldn’t shake: if the economy was growing and nearly everyone who wanted a job had one, why did so many Americans feel poorer every year?
After just a few simple calculations, the reason became clear. By Green's math, it took about $140,000 a year for a family of four to get by without government help. That was more than four times the official poverty line of roughly $32,000.[0A]
Green traced the gap to the line’s origins. Mollie Orshansky, a Social Security Administration economist, built it in 1963 and 1964 from the Agriculture Department’s cheapest food budget, the “economy food plan,” tripled, because families in the 1950s spent about a third of their after-tax income on food. Washington adopted her formula as the official measure in 1969 and has updated it for prices ever since. The household budget underneath it has never been revised, even though food now takes only about 13 cents of each dollar a family spends.[0B]
Green then tried to price the life a working family actually leads. Health coverage that Blue Cross once sold for about ten dollars a month had become the biggest expense for many households. The cost of housing had surged. And child care, which hardly existed as a paid market in 1963, was his largest line item at nearly $33,000 a year. This of course was a direct consequence of the second paycheck most families now needed to afford everything else. For a family of four in suburban New Jersey, his budget came to $118,009 after taxes, about $136,500 before them.[0C]
The reviews from economists were brutal. AEI’s Scott Winship called it the worst poverty analysis he had ever seen, his colleague Kevin Corinth called it “completely disconnected from reality,” and Noah Smith titled his response “The $140,000 Poverty Line is Very Silly.”[0D][0F]
Yet for all of the expert condemnation, the message was extraordinarily resonant. The Free Press ran it under the headline “Why Do Americans Feel Poor? Because They Are,” and Green was soon on cable news, in the Washington Post and CNN, and in a Sinclair segment syndicated to dozens of local stations.[0E] At Cato, Scott Lincicome, who thought the math laughably wrong, conceded that it had “clearly resonated with both the media and millions of everyday Americans.”[0F]
The issue of the year
The polls that followed found the same feeling at national scale. Eighty-four percent of Americans told AP-NORC in October 2026 that the cost of living was one of the most important issues for their vote.[0G] Gallup’s April reading was worse than anything it recorded during the financial crisis: 55 percent said their finances were getting worse, against 49 percent in April 2008 and 48 percent in October 2011, and it was the fifth straight year that pessimists outnumbered optimists. The University of Michigan’s consumer sentiment index hit 44.8 in May, the lowest since the survey began in 1952.[0I] Nearly half of Americans, 46 percent, rated their own lives worse than four years before, and in a WSJ-NORC poll just a quarter saw a good chance of raising their standard of living, the lowest share since 1987.[0I]
Those in charge kept insisting the economy was fine. Joe Biden toured the country in 2023 under the banner “Bidenomics is working” and told Congress in March 2024 that the American economy was “the envy of the world,” the same week 74 percent of voters rated it fair or poor in a New York Times/Siena poll.[0K] Kamala Harris wrote after her defeat that she had been surprised to find voters “focused on the cost of things today.”[0K] Trump, at a Cabinet meeting nine days after Green’s essay appeared, called affordability “a con job by the Democrats,” and he has since graded his own economy A-plus-plus-plus-plus-plus.[0L]
To be fair to them, they weren't without evidence. Unemployment hasn’t topped 5 percent in more than five years, a stretch unmatched since the 1960s, and real median household income set a record of $87,460 in 2025.[0M][0N] Yet in late 2025, three in five Americans told NPR, PBS News and Marist that the economy wasn’t working for them.[0N]
"The chart of the century"
A chart by the economist Mark Perry shows how both could be true. Perry first published it at the American Enterprise Institute in 2019 to show how far apart prices had drifted since the late 1990s.[5] His July 2026 edition, measured from 2000, shows hospital services have risen 291 percent, college tuition 200, child care 162, medical care 150 and housing 115. That's compared to overall inflation of 96%. On the other end of the spectrum, new cars rose only 26 percent and clothing 4, while cellphone service actually fell 45 percent, software 67, toys 73 and televisions 98.[6]
This episode and essay are about how we made the wrong stuff cheap.
PRICE CHANGES · 2000–2026
The prices that rose. The prices that fell.
Mark Perry’s July 2026 Chart of the Century. Percentage changes rounded to whole numbers. [6]
01 · 2000 — 2026
The cheapness machine.
How trade, shipping, retail and the microchip drove down the price of stuff.
A one-way street

Cheap goods started with a vote in Congress. Until 2001, China’s right to sell into the American market at normal tariff rates had to be renewed every year, and one failed vote would have restored the punitive rates of the 1930s. No Chinese manufacturer could build a decade-long export business on a one-year license. Congress voted in 2000 to make the arrangement permanent, effective when China joined the World Trade Organization in December 2001.[7]
Bill Clinton promised it would be “the equivalent of a one-way street,” opening China to American exports, and that the country would “export products without exporting jobs.” The House passed it 237 to 197. Imports of Chinese goods grew more than fivefold, from $100 billion in 2000 to $538.5 billion at their 2018 peak, until China was making about 85 percent of the toys sold in America and 78 percent of the cellphones it imported.[7]
The savings reached store shelves within a few years. Economists estimate that China’s entry knocked 7.6 percent off the price index for American manufactured goods between 2000 and 2006, and the gains were largest for poorer families, who spend a bigger share of their budgets on goods that cross borders. By one estimate, shutting off trade would cost the poorest tenth of Americans about 69 percent of their real income, against 4 percent for the richest tenth.[8]
The box and the store
Part of the reason opening up trade with China made physical goods cheaper was standardized containers. Before them, cargo moved piece by piece. A single freighter crossing the Atlantic in 1954 carried 194,582 separate sacks, barrels, crates and cartons, each loaded by hand. Loading and unloading ate up more than a third of the cost of a voyage. A standard steel box removed most of that work, because a crane could lift it off a ship and set it on a train or truck without anyone opening it. When Malcom McLean’s Ideal-X sailed from Newark in 1956 with 58 containers, loading cost 15.8 cents a ton, against $5.83 a ton for loose cargo.[N10] The bigger the ships got, the thinner that cost was spread. The Emma Maersk, launched in 2006, had room for about 15,000 containers, so moving one more television or one more pair of shoes across the Pacific cost almost nothing.[9]
China came to containers late, because it had spent decades cut off from world trade. Shanghai didn’t open a container terminal until 1983. Its traffic took off through the 1990s, and by the time China joined the WTO it was growing faster than almost any port anywhere. By 2006 it was moving more boxes than North America’s three biggest ports combined, and in 2010 it passed Singapore as the busiest container port in the world.[9]
Cheap goods at an American dock still had to reach a shelf in every town, and Walmart built the machinery for that last stretch. Its stores were fed by regional distribution centers linked by one of the earliest computer networks in retail. Bar-code readers in its warehouses had cut the labor cost of handling shipments in half by the late 1980s. Its Retail Link system, launched in 1990, let suppliers see what was selling store by store.[N11] Between 1999 and 2006, the chain grew from 564 supercenters to almost 2,000. That size let it dictate prices to the companies that supplied it. Vlasic found out when Walmart put its gallon jar of pickles on sale for $2.97, a deal that moved enormous volume and gutted the pickle maker’s profits. More and more of what filled the shelves came directly from China. By 2004 Walmart was the largest American importer of Chinese consumer goods, and the Economic Policy Institute later estimated that its China trade alone accounted for about 15 percent of the growth in the US goods deficit with China between 2001 and 2013.[10]
The savings went to shoppers, as Sam Walton had promised in 1992 when he pledged to “lower the cost of living for everyone.” Studies put Walmart’s prices 8 to 27 percent below its competitors’, depending on the product and the market.[N11] In 2005, Jason Furman, later chair of Barack Obama’s Council of Economic Advisers, called the company “a progressive success story.”[10]
Online retail carried the same network to the front door. Amazon Prime launched in February 2005, offering unlimited two-day shipping for $79 a year, and Amazon now handles about 40 percent of what Americans buy online. In the early 2020s, Shein and Temu skipped the American warehouse altogether, mailing packages from Chinese factories straight to American homes, duty-free if they were worth under $800. Temu’s first Super Bowl ad, in 2023, told viewers to “shop like a billionaire.”[10A]
One device
Electronics fell furthest of all, on the strength of Gordon Moore’s prediction that the transistors on a chip would double every two years. In the 1980s and 1990s that doubling delivered mostly speed. In the 2000s it delivered price, as the cost per transistor dropped about 25 percent a year. Each new generation pushed the one before it down to bargain prices, and since nearly every consumer device is built around chips, the products followed them down. By 2016, 90 percent of American households had a computer. A 42-inch plasma television cost more than $15,000 in the late 1990s. By Black Friday 2006, a 42-inch flat screen was a $799 doorbuster, and a 55-inch 4K set now sells for a few hundred dollars.[11]
The iPhone pushed prices down another way, by folding a shelf of separate gadgets into one device. Steve Jobs unveiled it in January 2007 as three products in one, an iPod, a phone and an internet communicator, and it went on sale that June for $499 or $599 on a two-year contract; within three months the 8-gigabyte model was down to $399.[12] Assembled in China, crossing the Pacific by container and sold through big-box and online stores, it was built from every piece of this story. It already did the work of a camera, a calculator and an alarm clock, and the App Store, which opened in July 2008, added millions of other uses. When the writer Steve Cichon held his phone up against a 1991 Radio Shack ad in 2014, it replaced 13 of the 15 gadgets on the page, which together had cost about $7,500 in today’s money.[12][13]
The phone also made a long list of things nearly free. Americans took about 80 billion photos in 2000, at roughly 50 cents each to develop; by 2015 they were taking 1.6 trillion at no cost per shot. Spotify, which reached the US in 2011, put most of the world’s recorded music behind a $10 monthly subscription. Asked what they would need to be paid to give these services up for a year, people in one study named a median of $17,530 for search engines, $8,414 for email and $3,648 for digital maps.[13] Ninety-one percent of American adults now own a smartphone, up from 35 percent in 2011, including 82 percent of those in households earning under $30,000, and it handles their banking, their work email, their children’s school portals and the family group chat.[13] Still, as indispensable as it is, none of the things the smartphone does lowered the rent, the insurance premium, the tuition bill or the day care invoice.
The bill
What's more, the towns that used to make those goods paid for the savings. The country lost nearly 6 million manufacturing jobs between 2000 and 2010, falling from 17.3 million to 11.4 million, and economists attribute 2.0 million to 2.4 million of the jobs lost between 1999 and 2011 to competition from China. Places hit hardest saw marriage and birth rates fall, and many had not recovered by 2019.[14A] When then-President Barack Obama asked Steve Jobs what it would take to make iPhones in America, he simply responded: “Those jobs aren’t coming back.”[14A]
02 · 1929 — 2026
The price of participation.
How the things a life is built on got expensive.
A roof

Median home price / median household income [15]
Pew found that 89 percent of adults under 40 think buying a home is harder for them than it was for their parents, and the Urban Institute’s numbers show why: since 2017, home sale prices have climbed 81 percent and rents 54 percent, against 43 percent for average earnings.[15]
The roots go back to the 2008 crash, which gutted the homebuilding industry. Census figures show housing starts falling about 79 percent between January 2006 and April 2009, and the 2010s started roughly half as many homes as the 2000s, the slowest decade since the 1960s.[15] Residential construction lost more than 40 percent of its workforce between 2006 and 2011, half of all homebuilding companies disappeared between 2007 and 2012, and construction lending is still less than half its 2008 peak; none of the three has fully recovered.[15]
A median home that cost 3.2 years of household income in the 1990s now costs 4.7, and the monthly principal and interest on one has more than doubled since 2019, from about $1,031 to roughly $2,300.[15]
Estimates of the shortfall run as high as 10 million homes, in a White House report from April 2026, with Zillow at 4 million and McKinsey at 8 million, and the Census Bureau puts vacancy at about 1 percent for owner-occupied homes and 7 percent for rentals, both far below their 25-year norms.[16] Builders completed roughly 418,000 houses of 1,400 square feet or less a year in the late 1970s and about 65,000 in 2020, and Fed Governor Michael Barr calculates that the share of rentals going for the equivalent of $1,000 a month or less fell from 55 percent in 1980 to about 20 percent in 2024.[16]
Locked in
Cheap pandemic mortgages then froze much of the housing that already existed. The 30-year rate bottomed at 2.65 percent in January 2021 and held near that level for more than a year; today about one mortgage in five is below 3 percent and roughly half are below 4, while new loans run above 7.[19]
An owner who financed $334,000 of a median-priced $418,000 house at 3 percent pays about $1,408 a month. Buying the identical house at 7 percent would cost $2,222, a 58 percent jump, or nearly $10,000 a year.[19] Few people make that trade, so the homes they would have sold stay off the market. The Federal Housing Finance Agency calculated that lock-in eliminated about 1.72 million sales from 2022 through 2024 and raised prices about 7 percent, and Redfin’s chief economist, Daryl Fairweather, called the gap between pandemic buyers and everyone else an “unfortunate inequality.”[20]
The mortgage cost of moving.
58% more for the same house.
Monthly principal and interest on a $334,000, 30-year mortgage. [19]
Zoning
Local rules have kept the shortage in place. Ezra Klein and Derek Thompson’s Abundance documents how zoning, environmental review and neighborhood vetoes block new housing, and Jared Bernstein, Joe Biden’s chief economist, concluded that “federal housing policy is stuck in a really weak equilibrium,” because Washington asks so little of the cities and states that control land use.[17] Adding to the challenge, existing homeowners mostly want their largest asset to keep appreciating. Echoing that, Trump told his Cabinet in January 2026 that he didn't want to reduce the price of houses. Instead, he wanted to “drive housing prices up for people that own their homes.”[17]
Austin shows a glimmer of hope for what could be. Its rents doubled from 2010 to 2019, among the fastest increases of any big American city. Over the following years, however, it loosened its zoning, culminating in the 2023 HOME initiative, which allowed three homes on most single-family lots and cut the minimum lot size by 70 percent.
From 2015 to 2024 Austin added 120,000 homes, expanding its housing stock by 30 percent, triple the national pace, and median rent dropped from about $1,500 at the end of 2021 to about $1,300 at the start of 2026 while 18,000 people moved in.[18] Minneapolis, which abolished single-family-only zoning in its 2040 plan, grew its housing stock 12 percent between 2017 and 2022 and held rent growth to 1 percent; the rest of Minnesota added 4 percent more housing and saw rents rise 14 percent.[18] Unfortunately, few cities have followed them, and the national shortfall is still counted in the millions.
The doctor’s bill
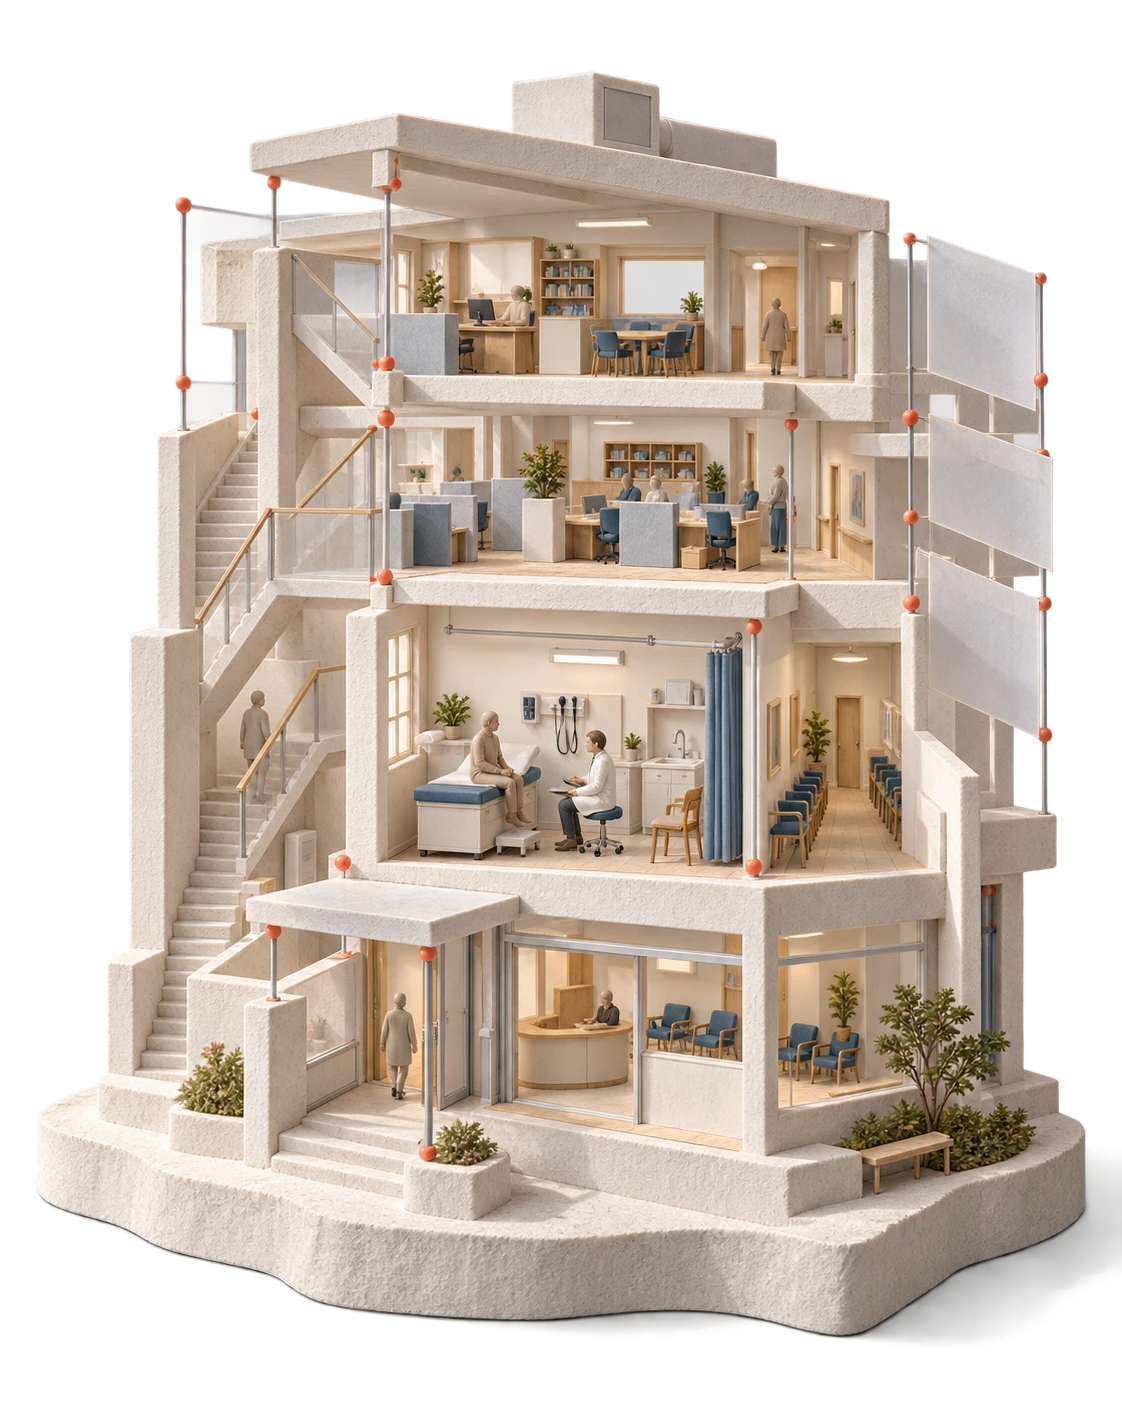
Sixty-two percent of Americans told KFF in September that they worry about paying for their families’ health care.[21] No other rich country charges like the United States. A hip replacement here averages about $29,000 and a C-section or an appendectomy about $14,000, roughly three times the price in peer nations, and major drugs can cost six times what they cost in Germany or Britain. The average family premium for job-based coverage has grown from $5,791 in 1999 to $26,993, with workers’ own contributions up from $1,543 to $6,850, and the share of covered workers facing a deductible of at least $2,000 rose from 7 percent in 2009 to 34 percent.[21] The money doesn’t buy more care. Per capita, the US has fewer physicians, nurses and hospital beds than peer countries, a finding that led Johns Hopkins’s Gerard Anderson to conclude, “It’s not that we’re getting more; it’s that we’re paying much more.”[21]
The annual price of family health insurance.
Worker contribution: $1,543
Worker contribution: $6,850
Average annual premiums for employer-sponsored family coverage. [21]
An accident of war
As NPR’s Planet Money once noted, American employers don’t buy their workers’ groceries or gasoline, so it is worth asking why they buy health insurance. The answer begins in an era when insurance made no sense. In 1900, the typical American spent about $5 a year on medical care, much of it on potions and tinctures of dubious origin. Only when medicine started curing people did it become expensive enough to insure against.[22]
The first plan was a Depression-era rescue. In 1929, Baylor University Hospital in Dallas had empty beds and was running out of money, and an administrator pointed out that Americans were spending more on cosmetics than on hospital care. Justin Ford Kimball, a former superintendent of the Dallas schools, signed up the city’s teachers at 50 cents a month for up to 21 days of hospital care, and more than 1,300 joined, close to three-quarters of the district. The model spread to struggling hospitals nationwide and became Blue Cross, sold to groups of employees from the beginning.[22]
The war fixed it in place. Wage controls imposed in 1942 to contain inflation left factories that badly needed workers unable to raise pay, so they competed instead with benefits. The War Labor Board decided in 1943 that health and pension benefits fell outside the wage freeze, the IRS decided the same year that they weren’t taxable. Congress later formalized that exclusion into the tax code in 1954. Nine percent of Americans had coverage in 1940 and by the 1960s it was about 70%.[22]
How it raised the price
The tax exclusion, now the biggest break in the federal code at about $299 billion in 2022 and projected by the Congressional Budget Office to cost $7.2 trillion over the next decade, made a dollar of insurance worth more than a dollar of salary. The result was coverage that paid for checkups and prescriptions as well as catastrophes, obfuscating the actual costs of services along the way.[22]
Workers end up paying for that coverage, just not directly. Employers cover about three-quarters of the average family premium, and economists find that money comes out of the raises workers would otherwise have gotten. RAND traced what that meant for a typical family between 1999 and 2009. Its income rose from $76,000 to $99,000, but after higher health costs, taxes and inflation, it had only $95 a month more to spend. If health costs had grown at the same pace as everything else, the family would have had $545 a month more.[22]
The system also left no buyer big enough to bargain hospitals down. Other rich countries set or negotiate hospital prices through a national system or a few large payers. In the US, only Medicare has that kind of clout. It sets its own rates for tens of millions of patients, and hospitals can’t afford to turn them away. Everyone else is covered by private plans that each negotiate on their own, and those plans pay hospitals about 254 percent of what Medicare pays for the same care.[22]
Out-of-pocket spending, the part of the bill patients actually see, fell from 52 percent of health spending in 1960 to 11 percent in 2019. RAND’s Health Insurance Experiment had already shown what visible prices do: people who paid for most of their care themselves spent about 30 percent less, with no measurable difference in their health.[24]
Consolidation supplied the pricing power. About 1,500 hospital mergers were announced over the first two decades of the century, and a 2017 study found highly concentrated hospital markets in more than 90 percent of metropolitan areas.[23][N1] Monopoly hospitals charge about 12 percent more than hospitals with four or more competitors nearby, and Martin Gaynor, a former director of the FTC’s Bureau of Economics, told Congress in 2019 that “price increases on the order of 20 or 30 percent are common” when close rivals merge.[23][N2] Hospital systems and private equity firms also bought physician practices and the contractors that staff emergency rooms and anesthesia departments, until about three in four American doctors worked for a hospital or a corporation by 2024. After EmCare, a private-equity-backed staffing firm, took over hospital emergency departments, its out-of-network billing rose by more than 70 percentage points within a year, part of the surge in surprise bills that Congress curbed with a ban that took effect in 2022.[23]
The fixes haven't worked
Reform after reform this century has left the prices intact. The 2003 law that created Medicare’s drug benefit forbade Medicare to negotiate drug prices. Obama campaigned in 2008 on cutting a typical family’s premium “by up to $2,500 a year,” which PolitiFact eventually scored as a broken promise, and after the Affordable Care Act passed, its assurance that “If you like your plan, you can keep it” was named the 2013 Lie of the Year. Individual-market premiums before subsidies more than doubled between 2013 and 2017, from $232 to $476 a month.[22A] The bigger marketplace subsidies Congress passed in 2021 became the cause of a 43-day government shutdown in the fall of 2025, the longest on record, and Congress still let them lapse at the end of the year. Marketplace enrollment dropped from 22.1 million to 19.2 million in 2026, and enrollees who kept the same plan saw their premium payments rise 114 percent.[22A] The exception came under the 2022 Inflation Reduction Act: Medicare’s first ten negotiated drug prices took effect on January 1, 2026, between 38 and 79 percent below list.[22A]
Some 20 million adults now owe at least $220 billion in medical debt, a third of adults have cut back on other spending to cover medical bills, and 11 percent have even skipped meals.[24]
The degree

College tuition is up 200 percent since 2000, second only to hospital services on Perry’s chart.[6] A year of tuition at a public university averaged $1,148 in 1983, about $3,800 in today’s dollars; in-state students now pay $11,950 on average and out-of-state students $31,880. Housing, meals, books and transportation bring the in-state total to about $31,000, with room and board alone, at $13,900, now costing more than tuition. Out-of-state students pay about $51,000 a year in all, private-college students about $65,000, and at 16 schools the annual cost now tops $100,000.[25]
The full annual cost of college.
Tuition, fees, housing, meals, books and other expenses before financial aid. Rounded annual budgets. [25]
At the same time, employers raised the bar. Jobs requiring education beyond high school made up 28 percent of the total in 1973, and Georgetown researchers project 72 percent by 2031. The requirement spread even to jobs that hadn’t changed: in a Harvard Business School study, two-thirds of postings for production supervisors demanded a degree that only 16 percent of current supervisors held.[25]
The rankings race
With demand guaranteed, colleges competed on prestige, and a magazine set the terms. U.S. News & World Report’s first rankings, in November 1983, were a reputational poll of 1,308 college presidents; in 1988 the magazine added hard data, weighted toward what schools spent. By 2016, “faculty resources,” which credited higher faculty salaries and smaller classes, counted for 20 percent of a school’s score, and “financial resources,” spending per student on instruction, research and services, for another 10.[25] Clemson, which set out in 2001 to climb from 38th to the top 20 public universities, raised its reported faculty pay by about $20,000, partly with tuition money, and engineered classes to fall just under 20 students, the size the formula rewarded. It reached 22nd.[25]
Ronald Ehrenberg and James Monks showed that a selective private college that slipped in the rankings had to accept a larger share of its applicants, enrolled fewer of those it admitted and gave more grant aid, collecting less from each student as a result. Price also worked as a signal of quality. When Ursinus College in Pennsylvania raised tuition and fees nearly 18 percent in 2000, applications rose by almost 200 the following year and its freshman class grew 35 percent over four years, a pattern one higher-education writer reduced to “It’s expensive, so it must be good.”[25] Posted prices have climbed ever since, along with the discounts colleges offer to fill their classes: private colleges now take an average of 56 percent off the sticker price for incoming freshmen, a record, and the families who receive no discount pay the full amount.[25]
The loans
Washington financed the competition. William Bennett, Ronald Reagan’s education secretary, argued in a 1987 New York Times op-ed that colleges were raising tuition because they knew federal aid would cover it, and decades later New York Fed economists found that each additional dollar of subsidized loan eligibility raised tuition by about 60 cents.[26] Graduate programs got an even freer hand in 2006, when Congress replaced the $18,500 annual borrowing limit for graduate students with the full cost of attendance; programs raised prices about 75 cents for every new dollar borrowed.[26]
Congress also made the debt nearly impossible to shed. Student loans could be discharged in bankruptcy like most other debts until 1976; Congress began restricting that then, eliminated the last time limit for federal loans in 1998 and extended the rule to private student loans in 2005. A borrower must now prove “undue hardship” in a separate lawsuit, a test few pass.[26] Outstanding student debt has nearly quadrupled, from $481 billion in early 2006 to $1.86 trillion. The 42.8 million Americans with federal loans owe about $39,500 on average, and more than 9 million are in default.[26]
The debt also delays the next big purchase. Federal Reserve economists found that every additional $1,000 in student loans reduced homeownership among borrowers in their late 20s and early 30s by 1 to 2 percentage points, and that student debt accounts for about a fifth of the decline in young-adult homeownership between 2005 and 2014, more than 400,000 people kept from buying a home.[26]
Outstanding student debt nearly quadrupled.
Total student loans outstanding in the United States. [26]
The first years

National average cost, worker pay, and center margins [29]
In 1975, 39 percent of mothers with children under 6 were in the labor force; by 2024, 68 percent were.[29] Nobody planned the child care bill that followed. Green’s two-paycheck budget needs paid care, and care that relatives and neighbors once gave for free has become a market.
Child care averages $13,184 a year per child, about a tenth of a married couple’s median income and a third of a single parent’s. Infant care at a center costs more than in-state college tuition in 41 states. For two children in a center, the bill exceeds rent in every state with data.[29] In New York City, WNYC found, a family earning $86,000 might need about a quarter of its income to pay for care for one baby or toddler.[N3] Day care and preschool prices have climbed about 147 percent since 2000, against about 87 percent inflation overall, and for many families the problem is finding a slot at all: 51 percent of Americans live in what the Center for American Progress calls a child care desert, with more than three young children for every licensed space.[29] The workers who provide the care earn a median of about $16.82 an hour, and most for-profit centers run on margins under 1 percent, so the high price is nobody’s windfall. The shortage costs the economy about $122 billion a year, including $78 billion in lost earnings for parents, roughly $5,520 for each working parent of a child under 3.[29]
The veto
During World War II, federally funded centers under the Lanham Act cared for an estimated 500,000 children of women working in war industries, for less than $10 per child per day in today’s dollars, paid by Washington. The funding ended with the war, and the centers shut in early 1946 despite protests.[30]
In 1971, Congress went much further. The Comprehensive Child Development Act, championed by Senator Walter Mondale, would have created a national network of centers, free to the poorest families and priced on a sliding scale for everyone else, and it drew such broad support that one Senate aide remembered it as “the most bipartisan piece of legislation” he had seen.[30] Richard Nixon vetoed it in December 1971. Pat Buchanan drafted the veto message to reject the principle, not just the price tag, and Nixon’s message warned against committing “the vast moral authority of the National Government to the side of communal approaches to child rearing over against the family-centered approach.” Critics had attacked the bill as the Sovietization of American children, and Buchanan said years later that he wanted to stop it before it became an entitlement “of enormous size.”[30]
What families have today is a block grant that reached about one in six eligible low-income children as of 2011, and for everyone else a tax credit averaging $500 to $600 a year against a $13,000 bill.[30] The closest the country has come since was Build Back Better, which would have held child care costs to 7 percent of income for most families and made pre-K universal. The House passed it 220 to 213 on November 19, 2021. A month later Joe Manchin said, “I cannot vote to continue with this piece of legislation,” and it never reached a Senate vote.[30]
03 · THE COMMON THREAD
Why the essentials got expensive.
Four industries with the same affliction, and a fight over the cure.
The debate to explain why all these things happened (along with the preferred fix) shapes modern American politics. The explanations offered are diverse.
Baumol’s disease
Everything that got cheaper came out of factories, while the four essentials are produced by people, on site. In the 1960s, the economists William Baumol and William Bowen went through the budgets of arts groups to learn why they kept running deficits, and Baumol found the answer in a Beethoven string quartet. Written in 1826, it still takes four musicians about 40 minutes to play. A factory worker today turns out many times what one did in 1826, but the quartet produces exactly as much music per hour as it did then. The musicians still earn what modern professionals earn, because otherwise they would go do something else. So the cost of a concert keeps rising while the cost of almost everything made in a factory keeps falling.[35]
The same logic applies to any job where the product is a person’s time. Pay across the economy tends to rise together, because workers can switch jobs, and a day care center that paid far less than other employers would lose its staff. In a factory, rising wages are paid for by rising output, as better machines let each worker make more. In a day care room they aren’t, because one adult can safely watch only a handful of toddlers, and state licensing rules set the ratio.
Let's put some numbers on it. Say a factory worker and a day care teacher each earned $12 an hour in 1990. The factory worker assembled four televisions an hour, so each set carried $3 of labor. The teacher looked after six toddlers, so an hour of care for one child carried $2. By 2025 both earn $36 an hour. Automation lets the factory worker turn out 40 sets an hour, so the labor in each set has fallen to 90 cents. The teacher still looks after six toddlers, so the labor in each child’s hour of care has tripled to $6. Both workers got the same raise. One price fell 70 percent and the other tripled, and the day care center’s owner kept none of the difference.
The real prices follow the same pattern, only more extreme. Since 2000, televisions have gotten about 98 percent cheaper and day care about 147 percent more expensive.[6][29] Baumol spent decades on the idea and summed it up in the title of a 2012 book, The Cost Disease: Why Computers Get Cheaper and Health Care Doesn’t.[35]
Regulation
Venture capitalist Marc Andreessen blames the rules. In a 2023 essay he described education, health care and housing as bottlenecked by government and by the industries themselves and concluded that “Technological innovation in those sectors is virtually forbidden.”[31] Apartment buildings are illegal on 76 percent of San Francisco’s land. Most states make hospitals obtain a certificate of need before adding beds, buildings or major equipment, and in February 2025 North Carolina rejected three proposed hospitals near Raleigh, approving 70 of the 246 beds requested. New colleges need accreditation to receive federal aid, and accreditors are staffed largely by existing colleges, which led Andrew Gillen to observe that newcomers “must get permission from their competitors to enter the market.”[31]
Faster than wages
Noah Smith has noted the limit of these explanations. Baumol’s mechanism predicts prices rising in step with wages, and that is roughly what happened to haircuts and restaurant meals. Health care, child care and college outran wages by wide margins, so the cost disease can’t be the whole story.[34]
Two diagnoses
The Niskanen Center offers one answer. The think tank grew out of libertarian, free-market circles and has since moved toward the political center, where it is one of the institutional backers of the abundance agenda. In 2021 it gave the pattern a name, cost disease socialism, meaning a government that subsidizes the cost of essentials while restricting their supply.[32]
The argument starts with what Washington can and can’t do when a necessity gets expensive. It can’t build a hospital wing or certify a nurse itself, but it can help people pay, and it does. Federally backed mortgages and the mortgage interest deduction help buyers bid for homes. The tax break for employer insurance pays for health coverage. Federal loans pay for tuition, and subsidies and tax credits pay for child care. Meanwhile other rules hold the supply of each essential in place. Zoning limits how many homes can go up, licensing limits who can treat patients, certificate-of-need laws limit how many hospital beds can be added, and accreditation limits who can grant a degree.
Pour money into a market that can’t grow and the money ends up in prices. Picture a town with 100 apartments and 120 families who want them. A voucher that gives every family an extra $200 a month doesn’t create a 101st apartment. It lets every family bid $200 more, and rents rise until the extra money belongs to the landlords. The same thing happened across all four bills. Each new dollar of subsidized student loans raised tuition by about 60 cents, and each new dollar of graduate borrowing raised graduate prices by about 75 cents.[26] The tax break for employer coverage paid for insurance generous enough that patients stopped seeing prices, while certificate-of-need laws kept new hospitals from opening to compete.[22][31] Higher prices then bring calls for bigger subsidies, which push prices up again.
Niskanen’s remedy is to aim policy at supply instead of demand: loosen zoning, let more clinicians practice, end certificate-of-need rules and open accreditation to new schools, so that public money buys more homes, care and classes instead of higher prices for the same ones.[32]
Another popular explanation, however, holds that the essentials cost so much not because of the government, but because a few sellers control their markets. Its evidence starts with the hospital mergers and runs across the economy. The three biggest pharmacy benefit managers handled nearly 80 percent of the 6.6 billion prescriptions Americans filled in 2023, according to the Federal Trade Commission.[N4] Starting in 2012 with Greater Houston Anesthesiology, the private equity firm Welsh, Carson, Anderson & Stowe and its U.S. Anesthesia Partners bought up anesthesia groups across Texas, and economists estimate the rollup raised what patients paid by about 30 percent.[N5] In rental housing, competing landlords fed confidential data into RealPage’s software and let its algorithm suggest their rents, until Trump’s Justice Department reached a settlement in November 2025 barring the practice. “RealPage was replacing competition with coordination and renters paid the price,” said Abigail Slater, who runs the department’s antitrust division.[N6] On this view, the big players shape the rules in their own favor, and the cure is aggressive antitrust enforcement, including against private equity’s rollups of medical practices and rental housing.[33A]
Two explanations for high essential costs.
Supply restrictions
- Subsidies help people pay.
- Rules keep new supply from entering.
- Prices rise, prompting bigger subsidies.
Proposed remedyAllow more homes, providers and services to be built.
Niskanen Center [32]
04 · 2016 — 2026
A legitimacy crisis.
When an economy stops delivering the essentials, people stop believing in it.

In truth, we face not only an affordability crisis, but a legitimacy crisis.
Sixty percent of Americans told CBS News and YouGov in August 2026 that the American economy is unfair in the chances it gives people to get ahead, against 31 percent who called it fair, and 53 percent of those under 45 said their generation has worse prospects than their parents had.[36] In September, Gallup found socialism viewed favorably by 43 percent of Americans, its best showing since Gallup started asking in 2010, while big business fell to 35 percent, from 52 percent in 2019. Among Americans 18 to 34, socialism now outpolls capitalism, 57 percent to 43.[37][40] According to Opportunity Insights, about 90 percent of Americans born in 1940 out-earned their parents, and only about half of those born in the 1980s have.[39]
UPWARD INCOME MOBILITY
Fewer Americans out-earn their parents.
Share earning more than their parents, adjusted for inflation, by birth cohort. Opportunity Insights. [39]
The doubt has spread to Republicans. In a Fox News poll, 61 percent of Republican voters rated capitalism favorably, down from 72 percent in 2019, and only 41 percent felt strongly favorable, down from 54; 42 percent agreed that the economy is rigged for the wealthy, compared with 30 percent in 2018.[38] Tucker Carlson warned in May 2026 of “a very lopsided and unfair economic system guaranteed to radicalize young people,” and Vice President JD Vance said in August that young people shouldn’t be blamed for socialism’s appeal: “We’ve got to blame ourselves.”[38]
The populist turn
Bernie Sanders and Steve Bannon use the same word, oligarchs, for the people at the top, and Bannon has said that “American citizens are not going to be supplicants to the oligarchs.”[45] Since Trump’s first campaign, the economic agendas of the two parties have converged to greater or lesser extent on populism. Trump picked up the 10 percent credit card interest cap that Josh Hawley had written with Sanders; Biden kept Trump’s tariffs on China and raised the one on Chinese electric vehicles to 100 percent; and 17 Senate Republicans voted for Biden’s CHIPS Act.[45][46] National Affairs calls the result the "neo-populist economic consensus," skeptical of free trade and willing to use regulation and federal spending to steer the economy. Candidates in both parties have won on it since 2016.[46]
05 · WHERE WE ARE
The right abundance.
The campaigns are fighting over who is to blame for the prices.
Two-thirds of voters told the New York Times and Siena in January 2026 that a middle-class life is now out of reach for most people, and 77 percent said it is harder to attain than it was a generation ago.[47] “K-shaped” has become the shorthand for an economy in which the top tenth of earners account for about half of all consumer spending, up from about a third in the early 1990s.[47] Affordability will be the first test in November’s midterms and the central issue of the 2028 presidential race.
Then and now
In Green’s account of 1963, one income could cover a rented apartment or a mortgage, Blue Cross ran ten dollars a month and a summer job could pay college tuition. None of that holds for the New Jersey family he priced in 2025.[0C]
Paul Krugman told New York Times readers in May 2024 that the economy was in excellent condition, and by late 2025 he was calling it “political malpractice” to lecture people about how they should feel.[N7][44A] Kyla Scanlon, who coined “vibecession” to describe strong data and sour moods, now says the country is out of one, and The Atlantic’s Annie Lowrey has proposed “permacession” in its place.[44A][N8] Biden’s party lost the White House, and by this fall 65 percent of Americans blamed Trump’s policies for high prices, more than the 44 percent who had blamed Biden’s at the same point in his term.[0L] Trump’s own Treasury secretary, Scott Bessent, has drawn the lesson: “I’m never going to tell the American people how they feel.”[44A]
Senators Chris Murphy and Elizabeth Warren have urged Democrats to tell voters “who is getting screwed and who is doing the screwing.”[33A] Republican strategists, for their part, say they won’t repeat Biden’s mistake of telling voters “how good his s***** economy was for them.”[N9]

None of this was inevitable. Cheap televisions and phones didn’t arrive by accident. They came from a trade deal Congress voted on, a steel box designed to cut the cost of loading a ship, a retailer that built its whole business around the lowest price, and decades of engineers fitting more transistors onto a chip. The country set out to make things cheap, and it succeeded beyond anything the people who started it imagined.
The prices on the other side of the ledger were set by decisions too, many of them made to solve some other problem. A wartime wage freeze tied health insurance to jobs. A magazine’s ranking formula paid colleges to spend. A 1971 veto left child care to the market, and thousands of local zoning votes capped how many homes could go up.
Rules written for one era kept setting prices in the next, but rules can be rewritten. When Austin let builders build, rents fell even as the city grew. When Medicare was finally allowed to bargain, the first drugs it negotiated came in as much as 79 percent below list. And half a century after Nixon’s veto, New Mexico made child care free for every family.
The midterms will be fought over who caused the squeeze. The larger argument is whether the country that made a television nearly free can do the same for a home, a doctor’s visit, a degree and a year of child care. Nothing about the last twenty-five years says America can’t. It has already shown how much it can make cheap once it decides to. The next twenty-five years can be the right abundance.